Gold Prices Surge Amid Global Uncertainty as Investors Rush Toward Safe-Haven Assets in 2026 Market Rally
Apr 20, 2026
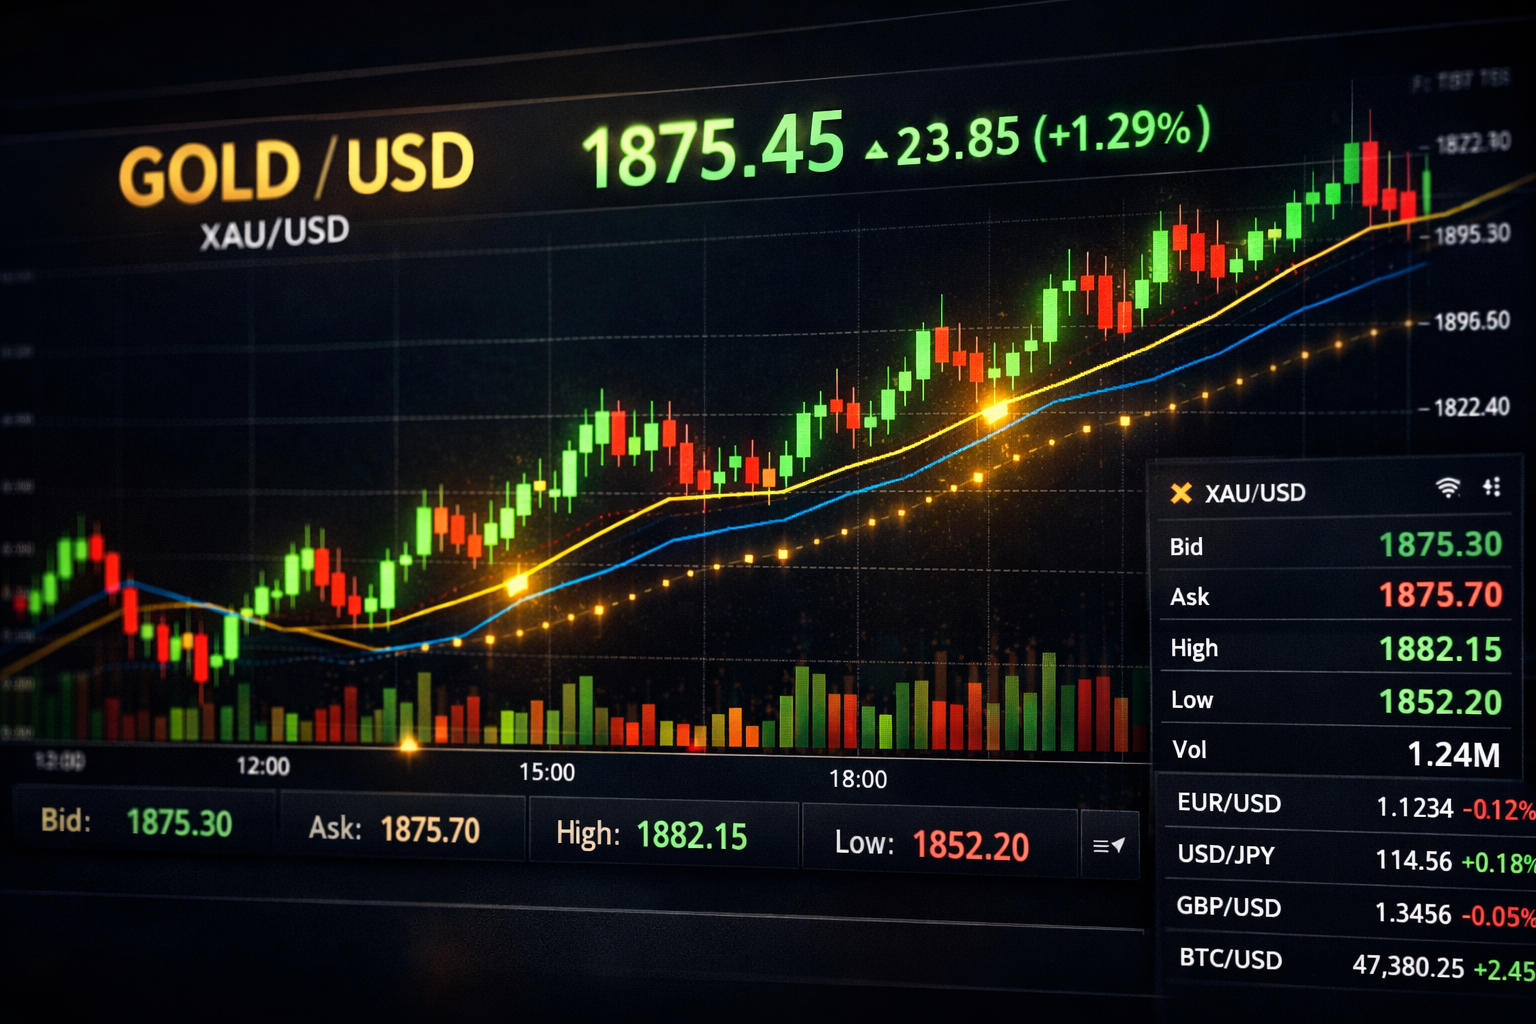
Gold has been the undisputed king of assets over the last two years, embarking on a historic rally that culminated in an all-time record high of $5,598 per ounce in January 2026.
However, the tides have shifted in May. Spot gold is currently experiencing a notable correction, trading down near $4,480 per ounce.
What is driving this recent pullback from record highs, and what do the world's biggest investment banks predict for the rest of the year? Let’s break down the macro forces moving the yellow metal right now.
Suggested Image Alt Text (SEO): Gold spot price chart tracking market correction amid rising bond yields in May 2026
The primary culprit behind gold’s current dip is a sudden, aggressive spike in U.S. Government Bond Yields.
Yesterday, U.S. Treasury yields surged to fresh cycle highs. The 10-year Treasury note hit a 16-month high of 4.7%, while the 30-year bond rocketed to an 18-year high of 5.2%—levels not seen since the 2008 global financial crisis.
Gold is a non-yielding asset—it doesn't pay a monthly dividend or fixed interest just for holding it. When government bonds start offering guaranteed, low-risk returns north of 5%, big institutional investors naturally rotate their capital out of gold and into Treasuries. This hawkish Federal Reserve outlook has simultaneously strengthened the U.S. Dollar, adding heavy overhead resistance to bullion.
Throughout early 2026, gold absorbed massive "fear premiums" due to escalating geopolitical tensions in the Middle East. However, diplomacy is beginning to cool the markets.
Hopes of a diplomatic breakthrough and an end to the conflict involving Iran have caused oil prices to pull back. As the immediate threat of an energy-driven global inflation wave eases, investors are unwinding their emergency safe-haven gold positions, causing futures to crater from their April recovery levels.
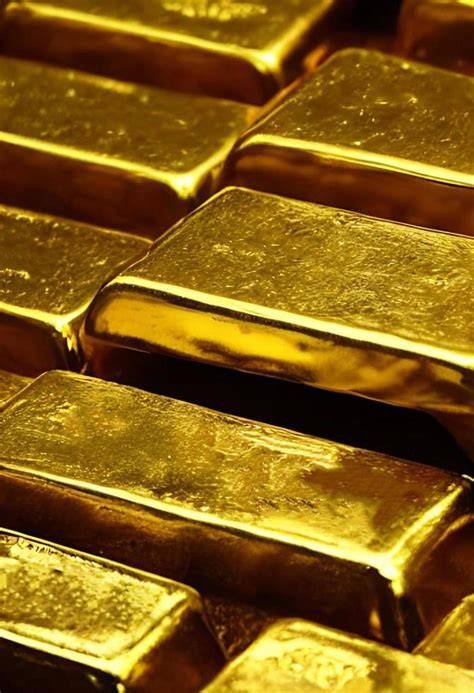
Suggested Image Alt Text: Central bank gold reserves and physical bullion storage tracking global demand
Despite the near-term correction, Wall Street's institutional consensus remains overwhelmingly bullish on gold's long-term structure. Central banks are continuing to aggressively diversify their reserves away from foreign exchange risks.
Major banks have recently adjusted their expectations, mapping out a clear "consolidation before continuation" path for the second half of 2026:
| Institution | 2026 Target Outlook | Core Catalyst Cited |
|---|---|---|
| Goldman Sachs | $5,400 / oz | Persistent structural central bank accumulation and geopolitical hedging. |
| UBS | $5,900 / oz (Upside to $6,200) | Long-term sovereign debt-servicing costs and global ETF demand rotation. |
| J.P. Morgan | $5,243 / oz (Revised from $5,708) | Near-term softer investor demand, but projecting a major rally toward $6,000+ by year-end. |
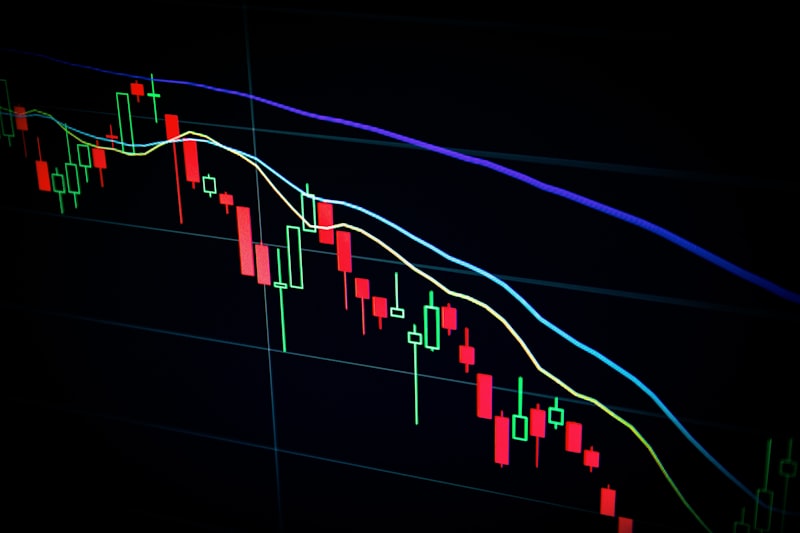
For traders watching the charts, gold spot (XAU/USD) is currently sitting below its major 20-day and 50-day moving averages, which are forming resistance overhead near $4,650.
Immediate Support: Market experts point to $4,350 as the critical macro support shelf, backed by the 200-day Simple Moving Average (SMA).
Immediate Resistance: Gold needs to cleanly reclaim $4,530 and $4,610 to invalidate the current short-term bearish momentum.
Gold isn't facing a structural crisis; it is experiencing a healthy, textbook correction after a relentless multi-year run. While high bond yields and a firm dollar are keeping a lid on prices this May, the underlying backbone of the market—elevated global debt, central bank reserve shifts, and policy uncertainty—suggests that gold's macro story is far from over.