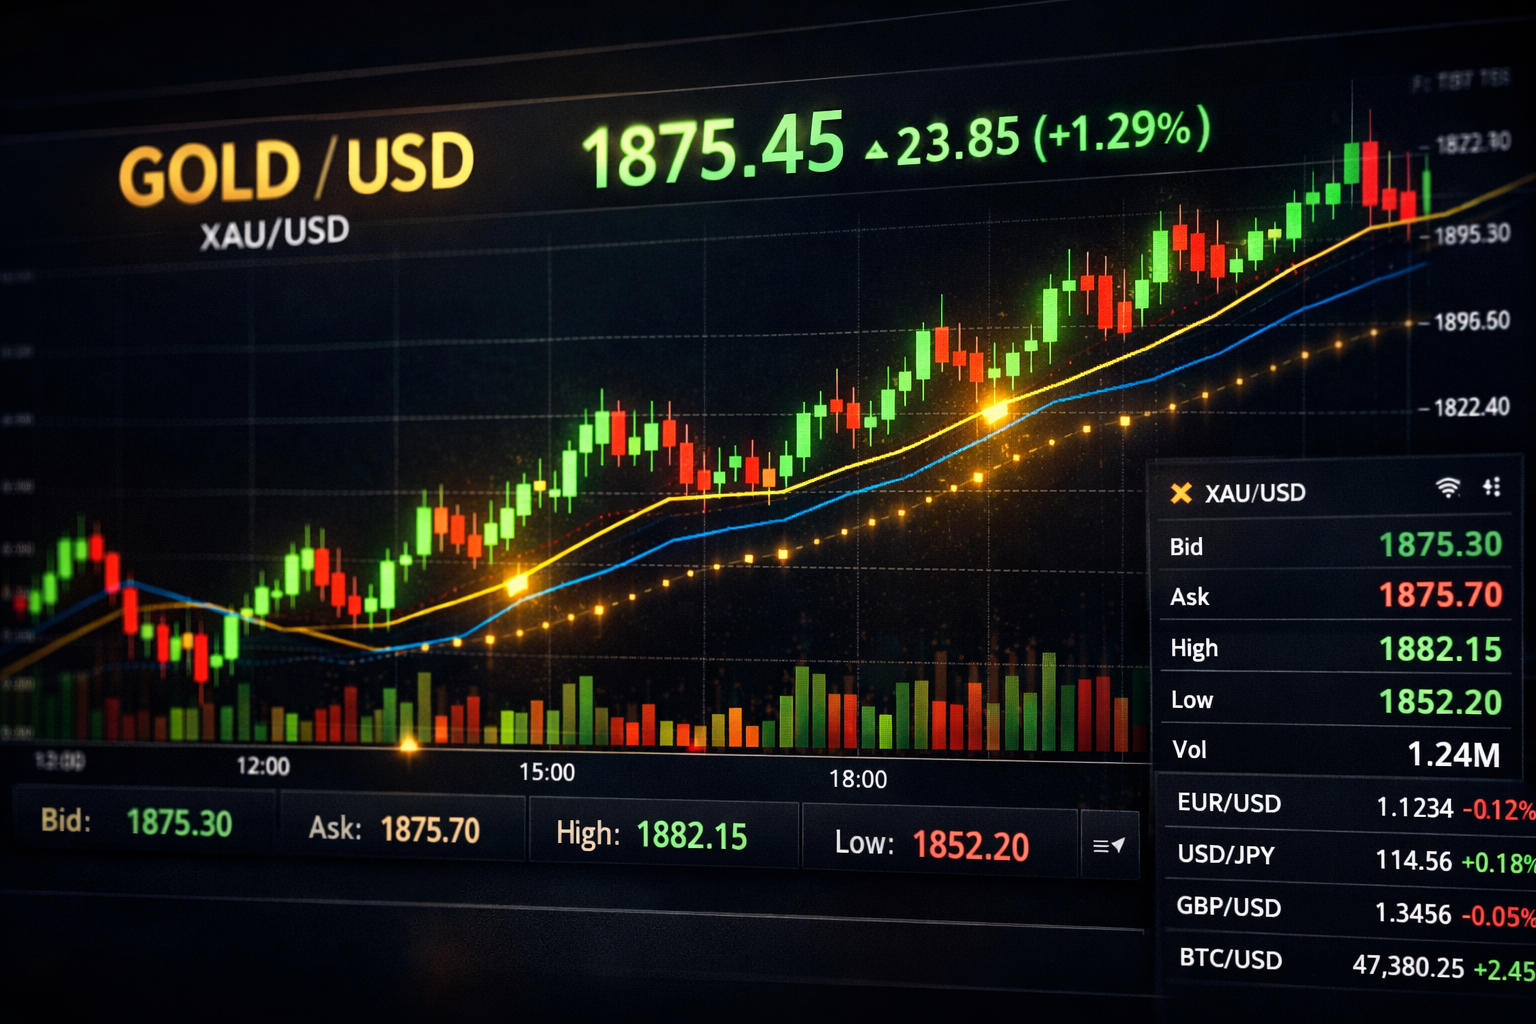
Gold Prices Surge Amid Global Uncertainty as Investors Rush Toward Safe-Haven Assets in 2026 Market Rally
Apr 20, 2026
Gold is navigating a vital structural turning point. Following a historic multi-year rally that saw bullion prices repeatedly shatter records over the past two years, the precious metal has entered a sharp, short-term corrective phase.
As of late May 2026, spot gold has retraced from its early-year highs, cooling off to trade right around the critical $4,500 per ounce support threshold. For investors, this pullback isn't a sign of weakness; it is a classic macroeconomic digestion period driven by a high-stakes standoff in the Middle East and a hawkish shift in Federal Reserve policy expectations. Here is what is driving the gold market right now.
The primary driver behind gold’s immediate volatility stems from a shifting geopolitical landscape. Initial market optimism spiked on reports that the U.S. and Iran were in the "final stages" of diplomatic talks to reopen the vital Strait of Hormuz shipping lane.
However, those gains quickly evaporated. Iran’s leadership publicly pushed back against claims of significant peace "progress," stating that the nation intends to retain its enriched uranium stockpiles—a firm red line for the U.S. and Israel.
The Market Reaction: While geopolitical tension typically drives safe-haven demand into gold, this specific standoff sent crude oil prices higher. Higher oil prices feed directly into global inflation, forcing institutional investors to completely rewrite their interest rate playbooks.
The ultimate headwind capping gold's near-term upside is the Federal Reserve's monetary stance. Newly released minutes from the Fed's latest interest rate meeting revealed a distinct shift in tone:
The Inflation Problem: With the U.S. cost of living rising at a sticky 3.8%, a strong majority of central bank policymakers indicated that further interest rate firming (hikes) may become appropriate if inflation remains unchecked.
The Impact on Bullion: Gold is a non-yielding asset. When interest rate expectations surge, the opportunity cost of holding physical gold rises, making dollar-denominated yields more attractive to institutional fund managers. This has triggered a wave of short-term profit-taking, knocking gold roughly 16% down from its all-time January highs.
Despite the short-term technical sell-off below the 50-day Exponential Moving Average (EMA50), the long-term structural floor for gold has never been sturdier.
The Sovereign Diversification Trend: De-dollarization is no longer a fringe theory; it is a central bank reality. Emerging market central banks continue to aggressively convert fiat paper reserves into physical gold bullion. This insulates their national balance sheets from U.S. debt inflation and fragile global alliances.
Even Wall Street’s largest banking conglomerates remain overwhelmingly bullish on the medium-term horizon. Institutional consensus forecasts for the remainder of 2026 continue to cluster around a $4,500 to $4,700 base range, with several major banks projecting a push toward $5,000 if global macro conditions fail to tighten.
| Core Metric | Current Value / Status | Strategic Implication |
|---|---|---|
| Spot Gold (Per Ounce) | ~$4,480 – $4,500 | Testing a major psychological and technical support line. |
| U.S. Inflation Rate | 3.8% | Persistently above the Fed's 2% target; driving rate hike fears. |
| Short-Term Trend | Bearish Corrective | Technical indicators (EMA50) favor short-term sellers. |
| Long-Term Target | $4,700 – $5,000 | Firmly supported by central bank hoarding and global debt. |
Gold is behaving exactly how a mature macro asset should: it is absorbing short-term policy uncertainty. While the technical charts indicate that selling pressure could temporarily dominate if the Fed leans further into a hawkish tone, the core pillars of the gold bull market—skyrocketing government debt, sticky global inflation, and structural central bank buying—remain completely unbothered. For patient allocators, the dip toward $4,500 represents a text-book accumulation window before the broader macroeconomic cycle inevitably turns back in gold's favor.
Gold price analysis chart support level 4500 federal reserve interest rates inflation trends 2026